
China’s Trade Brakes in US and EU, But Accelerates in Other Markets
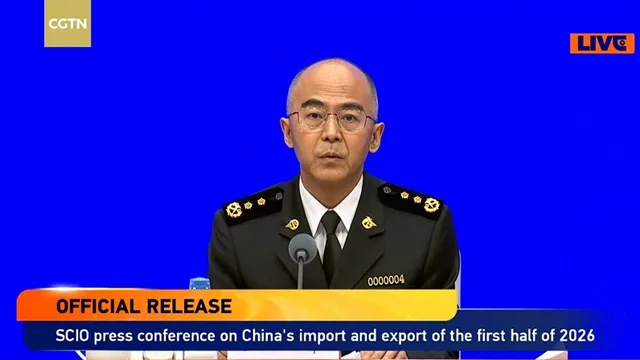
On 14 July 2026, Vice-Minister WANG Jun of the General Administration of Customs of China (GACC) held a press briefing to present China’s trade performance during the first half of 2026 (1H26). Based on Chinese trade data up to June 2026, one can perform some analysis of the 1H26 data and carry out a comparison with 1H25. First off, the trade volume increased to USD 3.75 trillion for the first semester of 2026, representing a 16.9% increase compared to the first half of 2025.
Interestingly, imports increased more than exports. In 1H26, imports soared by 22.1% to RMB 10.74 trillion, while exports increased by 13.4% to reach 14.73 trillion. The data indicate that AI hardware, intelligent robotics, and other smart products, based on AI, constituted the new growth areas.
“With the rapid development of artificial intelligence, China’s trade in AI-related products has gained strong momentum. In the first half of the year, imports and exports of computing hardware grew 56.6 percent. Meanwhile, smart products such as AI glasses, AI translators and robotic exoskeletons are rapidly evolving.”
GACC WANG Jun
Other than AI, green products also experienced a surge in demand. Another interesting trend is that private firms accounted for 57% to China’s global trade.
On a regional basis, the ranking remained stable with ASEAN, EU and LATAM on the podium for the top three. The African Union (AU) moved to 4th position with the fastest growth rate of any region at 24%. Actually, the EU slowed down with only 14.2% growth, compared to over 20% for other top regions.
| NO | REGION | 1H26 $B | 1H25 $B | % CHG |
|---|---|---|---|---|
| 1 | ASEAN | 626 | 511 | +22.5 |
| 2 | EU | 448 | 392 | +14.2 |
| 3 | LATAM | 307 | 255 | +20.3 |
| 4 | AU | 204 | 164 | +24.0 |
| 5 | GCC | 158 | 129 | +23.8 |
At the country level, the United States of America remained the top trading partner with a bilateral trade volume of USD 289 billion for 1H26. However, its trade remained basically unchanged compared to 1H25, due to the ongoing trade tussle between the two giants.
Australia distinguished itself by displaying a surge of 36.9% in 1H26 trade to reach USD 132 billion, compared to just USD 96 billion in 1H25. It is to be recalled that China and Australia reset their relationship in early 2026. China removed restrictions on Australian apples, barley, beef, to name a few, while Australia allowed more Chinese vehicles, including hybrid and electric vehicles, to enter its market.
The Special Administrative Region of Hong Kong also registered a remarkable jump in trade expansion of 48.1% to reach USD 222 billion during 1H26. Hong Kong serves as a global trading hub and transhipment hub for China, backed by special policies in its favor. Three product categories, namely, electronic components, AI and electronic hardware and precious metals, made up nearly 80% of the trade between China and Hong Kong.
| NO | COUNTRY | 1H26 $B | 1H25 $B | % CHG |
|---|---|---|---|---|
| 1 | USA | 289 | 289 | 0 |
| 2 | South Korea | 172 | 142 | +21.3 |
| 3 | Japan | 159 | 139 | +14.2 |
| 4 | Russia | 134 | 107 | +25.6 |
| 5 | Australia | 132 | 96 | +36.9 |
| 6 | Germany | 113 | 101 | +11.5 |
| 7 | Vietnam | 111 | 89 | +24.3 |
| 8 | Malaysia | 102 | 80 | +26.6 |
| 9 | India | 92 | 74 | +23.6 |
| 10 | Brazil | 90 | 76 | +19.7 |
For many years, GACC has been tracking trade with the group of countries within the Belt and Road Initiative (#BRI) — China’s flagship geoeconomic and geopolitical program. Comparing 1H26 with 1H25, the trade volume between China and BRI countries experienced a 14.8% growth to reach USD 1.9 trillion. BRI countries tend to receive preferential treatment and now account for more than half of China’s global trade.